- Home
- Apps
- Apps Reviews
- Zoho Chartistic Lets You Easily Create Graphs and Charts
Zoho Chartistic Lets You Easily Create Graphs and Charts

Numbers and data are a part of everyone's lives whether they release it or not. From simple things such as a sheet for daily expenses, to more complex things like a scorecard, charts and graphs definitely make numbers a lot less intimidating. We find it much easier to visualise data when looking at images as opposed to trying to remember numbers.
Zoho Chartistic is a free iPhone app that lets you make charts and we used it to find out whether it works for our charting needs.
The USP of Zoho Chartistic is making it easy to create charts, and the app is certainly easy enough to use. Hit the + button to create a new chart, and the app asks you to choose one out of five types of charts. Each of these are represented by icons only, which is a good thing considering this app is for people new to making charts.
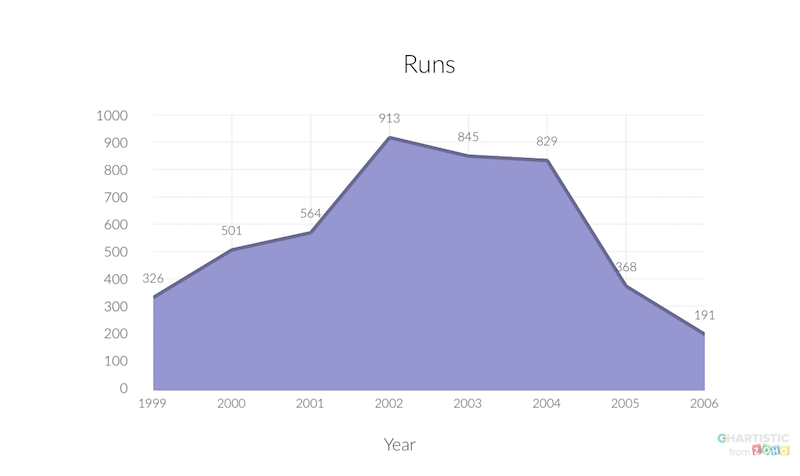
Once you select a chart, the app creates a chart with some random data. This is again a nice thing because you don't have to figure out how to create a chart. Quickly we figured out that swiping downwards lets you edit values manually, and dragging any of the nodes lets you adjust values on the chart itself. Swiping sideways opens the settings menu where you can adjust a bunch of details such as whether or not you want to see the grid and borders.
![]()
The charts we made using this app looked quite good but the app's interface could use some improvements. While flipping between different chart modes we discovered a bug that took half the chart off the screen; the only fix was to force quit the app. We encountered another freeze when changing multiple options in the settings menu. We tested the app on an iPhone 7, so the bugs are not due to slow or old hardware, but likely down to the fact that it's a new app and not all bugs have been ironed out yet.
The settings and editing screens don't look anywhere near as neat and polished as the charts themselves, but they get the job done. We'd have liked to have finer control over which colour to use for which bar or pie, but this feels like a design decision to keep the app simple. Tapping a button flips all the colours on your bar or pie chart, so eventually you are likely to find a colour scheme you like.
One neat feature of this app is clip arts. You can download clip art through the app itself and use it to help people visualise data. We created one showing the globe and a man on it, to highlight humanity's adverse effect on the environment.
Once you're done with a chart you have to hit the Save button to prevent it from disappearing. This is another issue the app needs to address - automatic, cloud saving has become the norm with most modern applications, and having to hit save before quitting feels archaic. All apps should automatically save your progress no matter which stage you're in. The app froze once while we were fiddling with settings and after force quitting, we lost the chart we'd worked on for 15 minutes. This is the kind of experience the developers should work to avoid.
![]()
Once you've saved a chart, you can open it again anytime and continue editing. The app uses the standard iOS share sheet to help you send charts to friends or post it online.
If making charts and graphs isn't something you'd normally do, Zoho Chartistic offers a fun way to make these. The app has a few issues that need to be ironed out but for the most part it is beginner-friendly and helps you turn boring, raw data into fun visuals.
Zoho Chartistic is a free download via the App Store.
Get your daily dose of tech news, reviews, and insights, in under 80 characters on Gadgets 360 Turbo. Connect with fellow tech lovers on our Forum. Follow us on X, Facebook, WhatsApp, Threads and Google News for instant updates. Catch all the action on our YouTube channel.
Related Stories
- Samsung Galaxy Unpacked 2025
- ChatGPT
- Redmi Note 14 Pro+
- iPhone 16
- Apple Vision Pro
- Oneplus 12
- OnePlus Nord CE 3 Lite 5G
- iPhone 13
- Xiaomi 14 Pro
- Oppo Find N3
- Tecno Spark Go (2023)
- Realme V30
- Best Phones Under 25000
- Samsung Galaxy S24 Series
- Cryptocurrency
- iQoo 12
- Samsung Galaxy S24 Ultra
- Giottus
- Samsung Galaxy Z Flip 5
- Apple 'Scary Fast'
- Housefull 5
- GoPro Hero 12 Black Review
- Invincible Season 2
- JioGlass
- HD Ready TV
- Laptop Under 50000
- Smartwatch Under 10000
- Latest Mobile Phones
- Compare Phones
- Vivo X200T
- Realme Neo 8
- OPPO Reno 15 FS
- Red Magic 11 Air
- Honor Magic 8 RSR Porsche Design
- Honor Magic 8 Pro Air
- Infinix Note Edge
- Lava Blaze Duo 3
- HP HyperX Omen 15
- Acer Chromebook 311 (2026)
- Lenovo Idea Tab Plus
- Realme Pad 3
- HMD Watch P1
- HMD Watch X1
- Haier H5E Series
- Acerpure Nitro Z Series 100-inch QLED TV
- Asus ROG Ally
- Nintendo Switch Lite
- Haier 1.6 Ton 5 Star Inverter Split AC (HSU19G-MZAID5BN-INV)
- Haier 1.6 Ton 5 Star Inverter Split AC (HSU19G-MZAIM5BN-INV)


